30/01/2025

Azure Map Routing

Azure map, replace earlier mapping technology provided by Microsoft which was called "Bing Maps".

Recently I had chance to look into Azure map routing feature (calculating route between two points) for my work. There fore, I thought I should write some blog about this new mapping technology by Microsoft.

My requirement was to calculate routed distance between two post codes in UK. In order to do this I had to use Azure Map routing APIs.

Before you start, first thing you must do is create a Azure Map account in your Azure portal.

In Azure portal, market place, search for "Azure Maps".


Then click on "Create" button under that. Fill the basic information for the account as shown in following screen shot.


If you wish you can fill other options as well, but for simplicity, I will keep them default.

In order to authenticate for Azure Maps, you can use either Microsoft Entra ID (active directory) permissions or can use shared key. For simplicity I will be using Shared Key Authentication.


Once account is created, go into that resource and go to Settings >> Authentication section.

You will see a section like above. Copy the Primary Key (or secondary key, either will work) and store in a safe place.


Now that we have an Azure Map and shared key to use it, we will now go and build the demo app for routing.

Console APP:

To keep it simple I'm going to create .Net core console application:


We are going to use Azure Maps routing client library for .NET.
https://www.nuget.org/packages/Azure.Maps.Routing

There fore install above nuget package to the newly create project.
NuGet\Install-Package Azure.Maps.Routing

Note that package is in pre-release as of now (25/01/2025), so you need to tick "Include pre-releases" box on the package manager window.

Initiate route client object:

//Create a MapsRoutingClient that will authenticate through Subscription Key (Shared key)
AzureKeyCredential credential = new AzureKeyCredential("<My Subscription Key>");
MapsRoutingClient client = new MapsRoutingClient(credential);

Replace the "My subscription key" part with your key from the Azure Maps Account. It is good idea to put this in configuration file and read it from there.

Note that I'm using shared key authentication, which is the simplest form of authentication, but you can use AAD (Azure Active Directory) authentication also. When using AAD authentication, you configure permissions on Azure Maps account for each AAD user.

Now I want user to input two post code (source and destination), so lets do the code for that:

            Console.WriteLine("Enter the start postcode:");
            string startPostcode = Console.ReadLine();

            Console.WriteLine("Enter the end postcode:");
            string endPostcode = Console.ReadLine();

Now we need to convert post code to geo coordinates (latitude and longitude) before sending them to Azure Maps API.

Simplest way to get geo coordinates from post code is use service like postcode.io. Postcodes.io is a free, open-source API specifically designed for UK postcodes.

Let's create a helper class to help with getting geo coordinates. Let's call it "PostCodeGeocoder".


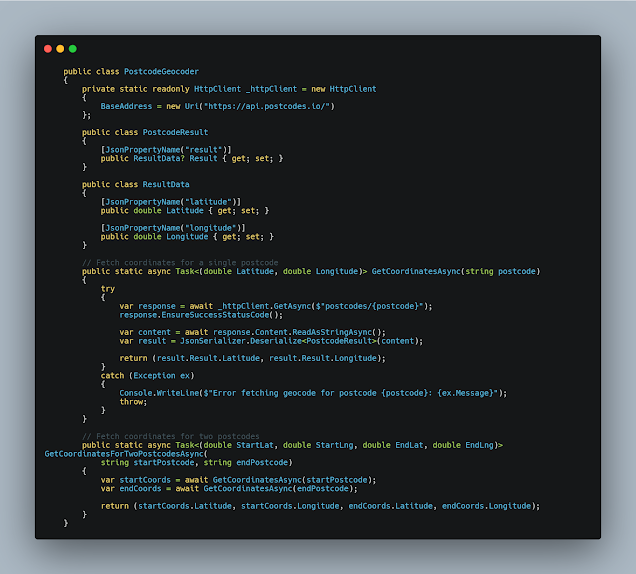
First part of the class is setting the base address for postcode.io api.

        private static readonly HttpClient _httpClient = new HttpClient
        {
            BaseAddress = new Uri("https://api.postcodes.io/")
        };

Then we have two inner classes to hold the latitude and longitude:

        public class PostcodeResult
        {
            [JsonPropertyName("result")]
            public ResultData? Result { get; set; }
        }

        public class ResultData
        {
            [JsonPropertyName("latitude")]
            public double Latitude { get; set; }

            [JsonPropertyName("longitude")]
            public double Longitude { get; set; }
        }

(Note that they have Json attribute to deserialize them correctly)

Code next to that is the heart of the class which brings the coordinates from postcode.io:

        public static async Task<(double Latitude, double Longitude)> GetCoordinatesAsync(string postcode)
        {
            try
            {
                var response = await _httpClient.GetAsync($"postcodes/{postcode}");
                response.EnsureSuccessStatusCode();

                var content = await response.Content.ReadAsStringAsync();
                var result = JsonSerializer.Deserialize<PostcodeResult>(content);

                return (result.Result.Latitude, result.Result.Longitude);
            }
            catch (Exception ex)
            {
                Console.WriteLine($"Error fetching geocode for postcode {postcode}: {ex.Message}");
                throw;
            }
        }

Last part call the above method for start and end post codes:

        // Fetch coordinates for two postcodes
        public static async Task<(double StartLat, double StartLng, double EndLat, double EndLng)> GetCoordinatesForTwoPostcodesAsync(
            string startPostcode, string endPostcode)
        {
            var startCoords = await GetCoordinatesAsync(startPostcode);
            var endCoords = await GetCoordinatesAsync(endPostcode);

            return (startCoords.Latitude, startCoords.Longitude, endCoords.Latitude, endCoords.Longitude);
        }

Now let's use our helper class in main program:

                var result = await PostcodeGeocoder.GetCoordinatesForTwoPostcodesAsync(startPostcode, endPostcode);

                Console.WriteLine($"Start Coordinates: Latitude = {result.StartLat}, Longitude = {result.StartLng}");
                Console.WriteLine($"End Coordinates: Latitude = {result.EndLat}, Longitude = {result.EndLng}");

Ok. now we got all our preliminaries.

Route matrix is as it sounds, is a 2D matrix (array).
You can enter as many origins (starting points) and as many as destinations (end points) to it. For example, if you enter 2 origins and 2 destinations, you will get 4 resulting routes.

For simplicity we will use one origin pint and one destination:

                // prepare our geolocations for origins and destinations (we just use one, but can use many as you like)
                List<GeoPosition> origins = new List<GeoPosition>() { new GeoPosition(result.StartLng, result.StartLat) };
                List<GeoPosition> destination = new List<GeoPosition>() { new GeoPosition(result.EndLng, result.EndLat) };

Then you can instantiate route matrix:

                // Instantiate route matrix query
                RouteMatrixQuery routeMatrixQuery = new RouteMatrixQuery
                {
                    Origins = origins,
                    Destinations = destination
                };

If you prefer you can override default options for route matrix by using RouteMatrixOptions class:

            // Instantiate route matrix options
            RouteMatrixOptions routeMatrixOptions = new RouteMatrixOptions(routeMatrixQuery)
            {
                RouteType = RouteType.Economy
            };

RouteMatrixOptions class allows you to configure your route, how you want to travel and route output. For example "TravelMode" define which travelling mode (car, van, buts, walk) you will be using.

See class reference for more detail.

You can call Route Matrix request synchronously and asynchronously. 

If you using synchronous mode, matrix element count should be less than 100.
I.e. : origins count * destination count should be <= 100

Calling Synchrounously:
Response<RouteMatrixResult> reqResult = client.GetImmediateRouteMatrix(routeMatrixQuery);

Calling Synchronously (with options):
Response<RouteMatrixResult> reqResult = client.GetImmediateRouteMatrix(options);

You can use asynchronous calling if the matrix has more than 100 elements. However, asynchronous method also only support 700 elements maximum.

Calling Asynchronously:

// Invoke an long-running operation route matrix request and directly wait for completion
GetRouteMatrixOperation reqResult = client.GetRouteMatrix(WaitUntil.Completed, routeMatrixOptions);

var routeResults = reqResult.Value;

Above will wait for completion and output results.

Printing results:

                // Route matrix result summary
                Console.WriteLine($"Total request routes: {0}, Successful routes: {1}",
                    routeResults.Summary.TotalRoutes,
                    routeResults.Summary.SuccessfulRoutes);

                // Route matrix result
                foreach (IList<RouteMatrix> routeResult in routeResults.Matrix)
                {
                    Console.WriteLine("Route result:");
                    foreach (RouteMatrix route in routeResult)
                    {
                        RouteLegSummary summary = route.Summary;
                        Console.WriteLine($"Travel time: {summary.TravelTimeInSeconds} seconds");
                        Console.WriteLine($"Travel length: {summary.LengthInMeters} meters");
                        Console.WriteLine($"Departure at: {summary.DepartureTime.ToString()} meters");
                        Console.WriteLine($"Arrive at: {summary.ArrivalTime.ToString()} meters");
                    }
                }

Getting Asynchronous results later:

Results are saved in Azure for 14 days. There fore you can access results later using the operation id. You need to save this operation id if you are going to use this method.

// Invoke an async route matrix request and get the result later via assigning `WaitUntil.Started`
GetRouteMatrixOperation operation = client.GetRouteMatrix(WaitUntil.Started, routeMatrixOptions);

// Get the operation ID and store somewhere
string operationId = operation.Id;

Then you can use the operation id to retrieve results.

// Within 14 days, users can retrieve the cached result with operation ID
// The `endpoint` argument in `client` should be the same!
GetRouteMatrixOperation newRouteMatrixOperation = new GetRouteMatrixOperation(client, operationId);
Response<RouteMatrixResult> reqResult= newRouteMatrixOperation.WaitForCompletion();

Results:
You will get result like below when you run the application:


Note that travel length is in meters, if you want in miles, you will have to do the conversion. Unlike BingMaps there is no option to get results in specific units.


Used following as a reference: https://github.com/Azure/azure-sdk-for-net/blob/main/sdk/maps/Azure.Maps.Routing/samples/RouteMatrixSamples.md


10/01/2025

Introduction to SQL Server Statistics - Tutorial

Wishing you all, my loving readers, Happy New Year 2025!

This is the first blog for the year 2025. As a new initiative, I'm going to (try to) write some tutorials on some selected features of the SQL server. This is my own take of these features, and written using knowledge I acquire over the years. Hope this will give something for the society. I'm also hoping to create a Youtube video associate to this. When I done, I will update the page to link to that.

Introduction to SQL Server Statistics

What are SQL Server Statistics

SQL Server statistics are mainly used by Query Optimizer, therefore before we talk about statistics, we need to know little about how SQL Server Query Optimizer works.

When running a query, there can many ways to execute it (different ways to get data, different ways to join them, etc.). Therefore SQL server need a plan before executing a query. We call it Query Plan.

Since there are can be many combinations of ways to execute a query, there can be lot of plans that optimizer can come up for one query.

Therefore, need to find the optimized plan, the best plan (or rather good enough plan …). Optimizer only have limited time to come up with a plan. It has to finish and present the plan quickly as possible. In this process optimizer, will try to find good enough plan quickly as possible. Hens, it need all the help it can get. 


In order to create the optimal plan, Query Optimizer analyse the query and then it need to know meta data about data that query is looking for.

For example query can be looking for total number of orders for one particular customer placed during a date range. To create plan for this query, optimizer need to look into orders table and customer table. 

It need to know roughly how many orders are placed during the given time period. Because depend on the number of rows we might need to do different things to aggregate the data. For example, if we find 100 rows, we can aggregate one way and if find 1M rows, we might not be able to use the same approach. 

It also need to allocate memory for query to run. In order to estimate amount of memory to allocate, it need to estimate how many rows it is dealing with.

It cannot count rows, because that will take lot of time. Optimizer need to report back to SQL server quick as possible.

So it need to find out how data is distributed on the order table. We call this cardinality estimate. This is where statistics come to play. Statistics hold how data is distributed in a table/column.

Creation of SQL Server Statistics

Statistics are create on indexes and columns. It can be on single column or combination of columns.
Two types of statistics
• Statistics create for index (can be multi columns)
• Statistics created for columns (only created on single column)

Statistics have 3 components
• Header -> meta information about statistics
• Density -> mathematical construct of the selectivity of column or column
• Histogram -> show how data is distributed

You can see statistics information by running following command

DBCC SHOW_STATISTICS(MyTable, MyIndex);


Let's create "Employee" table, which have Employee Id, Age, Salary and Gender as an example:
CREATE TABLE Employee (
    EmpId INT PRIMARY KEY, -- Primary Key column
    Age INT,    -- Integer column for age
    Salary NUMERIC(18,2),  -- Numeric column for salary with precision 18 and scale 2
    Gender VARCHAR(10),-- Gender of the employee
);

We will populate the table with some random data:
-- Insert 1000 random rows into the Employee table with salary rounded to the nearest 500
SET NOCOUNT ON;

DECLARE @i INT = 1;

WHILE @i <= 1000
BEGIN
    INSERT INTO Employee (EmpId, Age, Salary, Gender)
    VALUES (
        @i,  -- EmpId (using sequential numbers for simplicity)
        FLOOR(RAND(CHECKSUM(NEWID())) * (70 - 18 + 1)) + 18,  -- Age: random number between 18 and 70
        ROUND(CAST((RAND(CHECKSUM(NEWID())) * (100000 - 15000) + 15000) AS NUMERIC(18,2)), -2),  -- Salary: rounded to nearest 500
        CASE 
            WHEN RAND(CHECKSUM(NEWID())) < 0.4 THEN 'MALE'        -- 40% chance for MALE
            WHEN RAND(CHECKSUM(NEWID())) < 0.8 THEN 'FEMALE'     -- 40% chance for FEMALE
            WHEN RAND(CHECKSUM(NEWID())) < 0.9 THEN 'DUAL'       -- 10% chance for DUAL
            ELSE 'UNKNOWN'                                       -- 10% chance for UNKNOWN
        END -- Gender
    );

    SET @i = @i + 1;
END;

Create indexes:
CREATE INDEX IX_Employee_Age ON Employee(Age);

-- Create an index on the 'Salary' column
CREATE INDEX IX_Employee_Salary ON Employee(Salary);

-- Create an index on the 'Gender' column
CREATE INDEX IX_Employee_Gender ON Employee(Gender);

Let's check out stats now:
DBCC SHOW_STATISTICS(Employee, IX_Employee_Age);


Let's deep dive into each section in the statistic data structure:

Header
Header contains name of the statistics, when it was last updated, row count AT THE TIME of the statistic creation
• Name -> name of the index
• Updated -> when this was last updated
• Rows -> Number of rows at the time of the statistic creation/update
• Rows Sample

Density
How much variety (selectivity). Unique index has very high selectivity.
Density is a measure that provide insight into the selectivity of a column or combination of columns in an index

Density = 1 / Number of Distinct Values

Let's have a look at density data for Age index:


There are 53 distinct age values in Employee table (in the example data I have, this might be slightly vary on yours). So Density = 1/53 => 0.0188679245283019
But if you add primary key EmpId to that column, Density is => 1/1000 (because empid is unique in that table and we have 1000 rows)

If we look at density data for Gender index (where only 4 possible values)


So high density means less selectivity, optimizer will use this data to choose the correct indexes.
"Average Length" column in this vector shows average of total length of fields in consideration. E.g. in above Gender column in 5 characters in length.

Histogram

Let's take a look at histogram for the Salary Index: 

DBCC SHOW_STATISTICS(Employee, IX_Employee_Salary);

SELECT * FROM Employee WHERE Salary BETWEEN 80600.00 AND 81500.00
ORDER BY Salary

Let's take a look at data for 81500 bucket from the table


Histogram is the most used information in statistics.
Histogram in SQL server statistics is a data structure which describe the distribution of data in a column or index
• Histograms main structure contains up to 200 steps called, buckets
• If NULL values are allowed there is a special bucket for NULLs so 201 buckets
• If number of rows are below 200, steps will be lower than 200

• RANGE_HI_KEY -> Highest value in the range (81500)
• EQ_ROW -> Rows that equal to highest value (1 for above example for 81500 bucket, but 2 for 80600 bucket)
• RANGE_ROWS -> Number of other values between high value and previous high key (i.e. 80600) -> in above example 7 (80800, 80900, 81100, 81300, 81400)
• DISTINCT_RANGE_ROWS -> distinct values in range rows.
• AVG_RANGE_ROWS -> RANGE_ROWS/DISTINCT_RANGE_ROWS (i.e. 7/5 = 1.4)

Note that values are considered from high-key (bottom to top)

Creation of Statistics

Indexed Columns (Rowstore):
Creation of statistics in indexed column is automatic and cannot be turned off.

Non Indexed Columns
By default SQL server create stats for non-indexed columns if they are used as filtering columns in queries.
But you can turn this off

In order to see auto create stats is turned on or off

SELECT DATABASEPROPERTYEX('<<YOUR DB>>, 'IsAutoCreateStatistics')

OR

SELECT is_auto_create_stats_on 
FROM sys.databases 
WHERE name = 'YourDatabaseName'

In order to enable or disable auto create stats:
ALTER DATABASE <<your database>> SET AUTO_CREATE_STATISTICS ON/OFF

These auto-created statistics are single-column only and are named in the format: _WA_Sys_columnname_hexadecimal

To see created stats:

SELECT * FROM sys.stats 
WHERE object_id = OBJECT_ID('<<your table name>>')

SELECT * FROM sys.stats 
WHERE object_id = OBJECT_ID('dbo.Employee')


In this screenshot "PK__Employee_..." is the stats for primary key index, which will be created automatically and cannot be turned off. Same with all IX stats, those are stats for non-clustered indexes.

_WA_Sys one is the one created automatically.
Why they are prefix with _WA? Well there is no official statement from Microsoft, so some believe, it is stands for Washington, where Microsoft headquarters are in.

Currently there are no user created stats in there.

If you want to create statistics on a column (which is not normally recommended):
CREATE STATISTICS <<statistics name>>
ON <<table name>> (<<column name>>)
WITH [Options];

CREATE STATISTICS _mpa_Employee_Age
ON dbo.Employee (Age)
WITH FULLSCAN;

If we check stats for Employee tables now:


Note that, new manually created stats has "user_created" field set to true.

Update Statistics

SQL server update stats automatically. However, there might be occasions where updating statistics manually will give optimzer better advantage.

You can update stats using following T-SQL:
UPDATE STATISTICS <<table name>> <<stats name>>
[WITH [FULLSCAN | SAMPLE n PERCENT | SAMPLE n ROWS]];

Examples:
This update stats for all statistics in a table
UPDATE STATISTICS dbo.Employee

Alternatively, you can create management task to maintain statistics.


You can update statistics for all tables using following SQL:
EXEC sp_updatestats;

Remove Statistics

Though we don't really want to remove stats, in case it is required:

DROP STATISTICS <<table name>>;

DROP STATISTICS dbo.Employee

DBeaver Series - Part 1 - Installing and Connecting to Postgres

One of the common complain when you move to open source database is not having proper database management tool like SSMS for SQL server. The...